
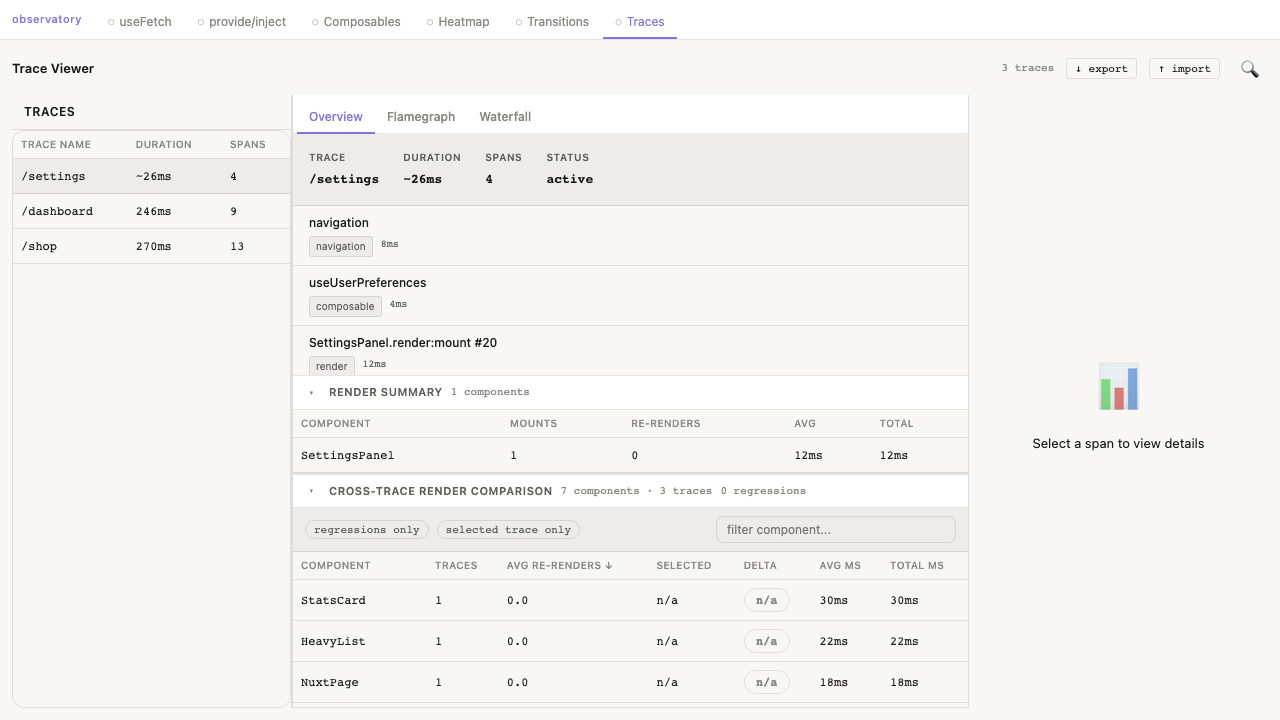
What it tracks
- Route navigation and total visit duration
- Component lifecycle and render spans
- Fetch timing and SSR/CSR origin
- Transition phase spans
- Composable setup spans (client and SSR)
- Server phase spans for SSR handling
- Vue / app / navigation errors attached to the active route trace
- Navigation abort spans when a route is superseded before
page:finish
What to watch for
- Components with high re-render count and total render cost
- Positive cross-trace delta (render regression)
- Slow spans on the route critical path
- Expensive SSR phases before response is returned
Quick workflow
- Open a trace and review Overview for hotspots.
- Use Flamegraph and Waterfall to inspect nesting and timing groups.
- In Cross-Trace Render Comparison, sort by delta and enable
regressions only.