
Nuxt DevTools Observatoryv0.5.0
  • Docs
  • Feature Guides
  • API
  • Releases
    • Getting Started
    • Configuration
    • Installation
    • Feature Guides
    • Composable Tracker
    • Pinia Tracker
    • provide/inject Graph
    • Render Heatmap
    • Trace Viewer
    • Transition Tracker
    • useFetch Dashboard
    • API Reference
    • Module Options
    • RPC Contracts
    • Troubleshooting
    • Common Issues
    • Performance At Scale

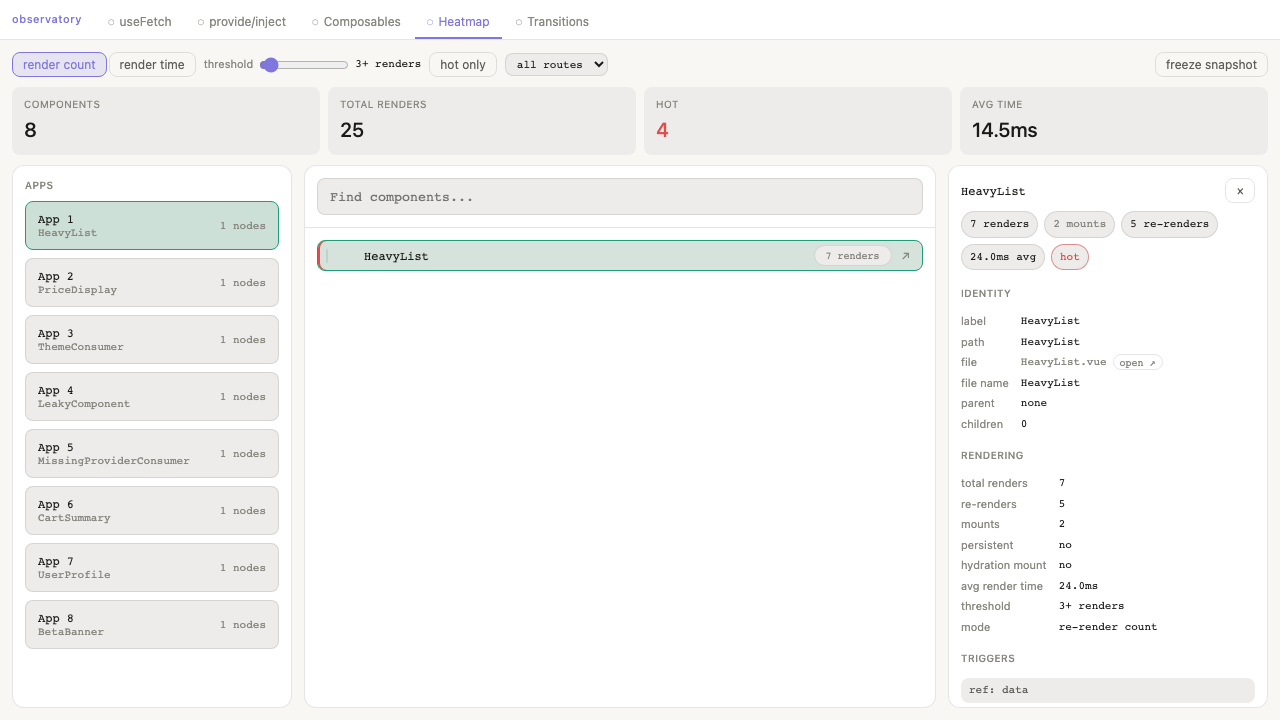
Render Heatmap

What it tracks

  • Render count and duration
  • Mount vs update events
  • Trigger keys (when available)
  • Route association

What to watch for

  • Components crossing threshold count/time repeatedly
  • Expensive updates on stable routes
  • Noise from internals (toggle hide internals)

Quick workflow

  1. Set threshold values for your app scale.
  2. Filter by route.
  3. Inspect timeline of the hottest component and correlate trigger keys.
Edit this page GitHub
← provide/inject GraphTrace Viewer →
Get StartedFeature GuidesGitHub
Nuxt DevTools Observatory • © 2026